


 12-13 / 52

A
ccording to the International
Energy Agency, in 2015 the
world added more renewables-
based power generation capacity
than all other technologies
combined for the first time
ever. In the same year the total
global installed renewables
capacity surpassed installed coal
capacity. This rapid deployment
of renewables is an important
step toward meeting the COP21
Paris Agreement to limit CO
2
emissions. In some locations
the existing grid infrastructure
was not designed to handle this
influx of often intermittent, and
often distributed generation but
other locations have been able
to accommodate several GWs of
renewables without significant
system change.
This trend toward increasing
renewables deployment is
expected to accelerate over the
coming decades. In its baseline
New Policies Scenario the IEA
predicts that by 2040 total global
generation capacity will increase
by more than 60% to more than
11,000 GW, and over 45% of this
total will be renewables capacity.
This shift to more renewables
capacity combined with the other
transformations in the ecosystem
require new ways of thinking
about the electricity system. Grid
operators and system planners
face many challenges including
the following:
• Integration of variable and
distributed generation
• Flat load growth—but faster
ramps with higher peaks
• Multiple gas turbine starts
per day
• Thermal fleets dispatched
to minimum loads
• Increased need for operating
spinning reserve
• Weak grid infrastructure
• Reducing emissions
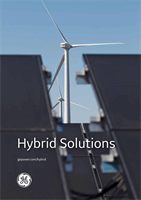
The California Independent
System Operator (CAISO)
created the “Duck Curve” to
demonstrate the challenges of
managing a changing electricity
grid as more renewables are
introduced into a system that
does not have enough flexible
resources to ensure grid
reliability. Hybrid solutions are
well suited to address these
challenges, and in fact, several
gas turbine/battery storage
hybrid systems have already
been deployed in California.
28,000
26,000
24,000
22,000
20,000
18,000
16,000
14,000
12,000
10,000
12 a.m.
3 a.m.
6 a.m.
Hour
Megawatts
9 a.m.
12 p.m.
3 p.m.
6 p.m.
9 p.m.
2012
(actual)
2013
(actual)
2014
2015
2016
2017
2020
2019
over generation risk
ramp need
~13,000 MW
in three hours
2018
Typical Spring Day
The duck curve shows steep ramping
needs and over generation risk
TYPICAL SPRING DAY
Hybrid solutions:
value
Use Case
Typical Hybrid Solutions
Typical Outcomes
Grid Autonomy
(Micro/Offgrid)
• Solar PV + BESS Storage +
Reciprocating Engine
Access to electricity everywhere
• Increase the availability of electricity to under-
served regions or regions with no access
• Increase grid stability in weak grid locations
• Reduce fuel costs by displacing some of the fossil
fuel with solar PV
• Portable – can be relocated if needs change
Dispatchability
of Renewables
• GT + Wind/PV + Storage
• Recips + Wind/PV + Storage
• Wind + Storage
• Solar + Storage
• Wind + Solar + Storage
• Hydro + Solar
• Wind Integrated Solar Energy
Baseload generation with renewables
• Reduce or eliminate curtailment by storing excess
supply for use during periods of low supply
• Increase the annual energy production through
complementary supply of wind and solar during
different times of the day
• Reduce system levelized cost of electricity
(LCOE) by optimizing the mix of renewables
and thermal supply
• Increase the predictability and dispatchability
of renewables to enable firm Power Purchase
Agreement participation
• Improve matching of production and consumption
CAPEX & OPEX
Improvement
• GT/CCGT + Storage
• Solar PV + BESS storage +
Reciprocating Engine
Using existing infrastructure and
O&M capabilities
• Reduced CAPEX by sharing plant electrical
evacuation equipment
• Reduce O&M costs through shared services
• Reduce fuel consumption and CO
2
emissions
by displacing fossil generation
• Reduce system LCOE by optimizing the mix
of renewables and thermal supply
T&D Deferral
• GT/CCGT + Storage
• Wind + Storage
• Solar + Storage
• Wind + Solar + Storage
• Hydro + Solar
• Solar PV + BESS Storage +
Reciprocating Engine
Storing energy to reduce stress on the
grid and reduce the need for newT&D
• Reduce T&D CAPEX by shifting generation
to meet peak loads
• Increase T&D expected lifecycle because
of lower peak utilization
• Enable more distributed energy resources
in the system
• Reduce peak demand charges by smoothing
the demand profile and avoiding load shedding
Peak Shaving,
Ramping,
Time Shifting
• GT/CCGT + Storage
• Wind + Storage
• Solar + Storage
• Wind + Solar + Storage
• Hydro + Solar
Increasing revenue opportunities
• Increase revenue through improved ability
to arbitrage wholesale power prices
• Increase revenue through increased participation
in multiple ancillary services markets
TYPICAL USE CASES
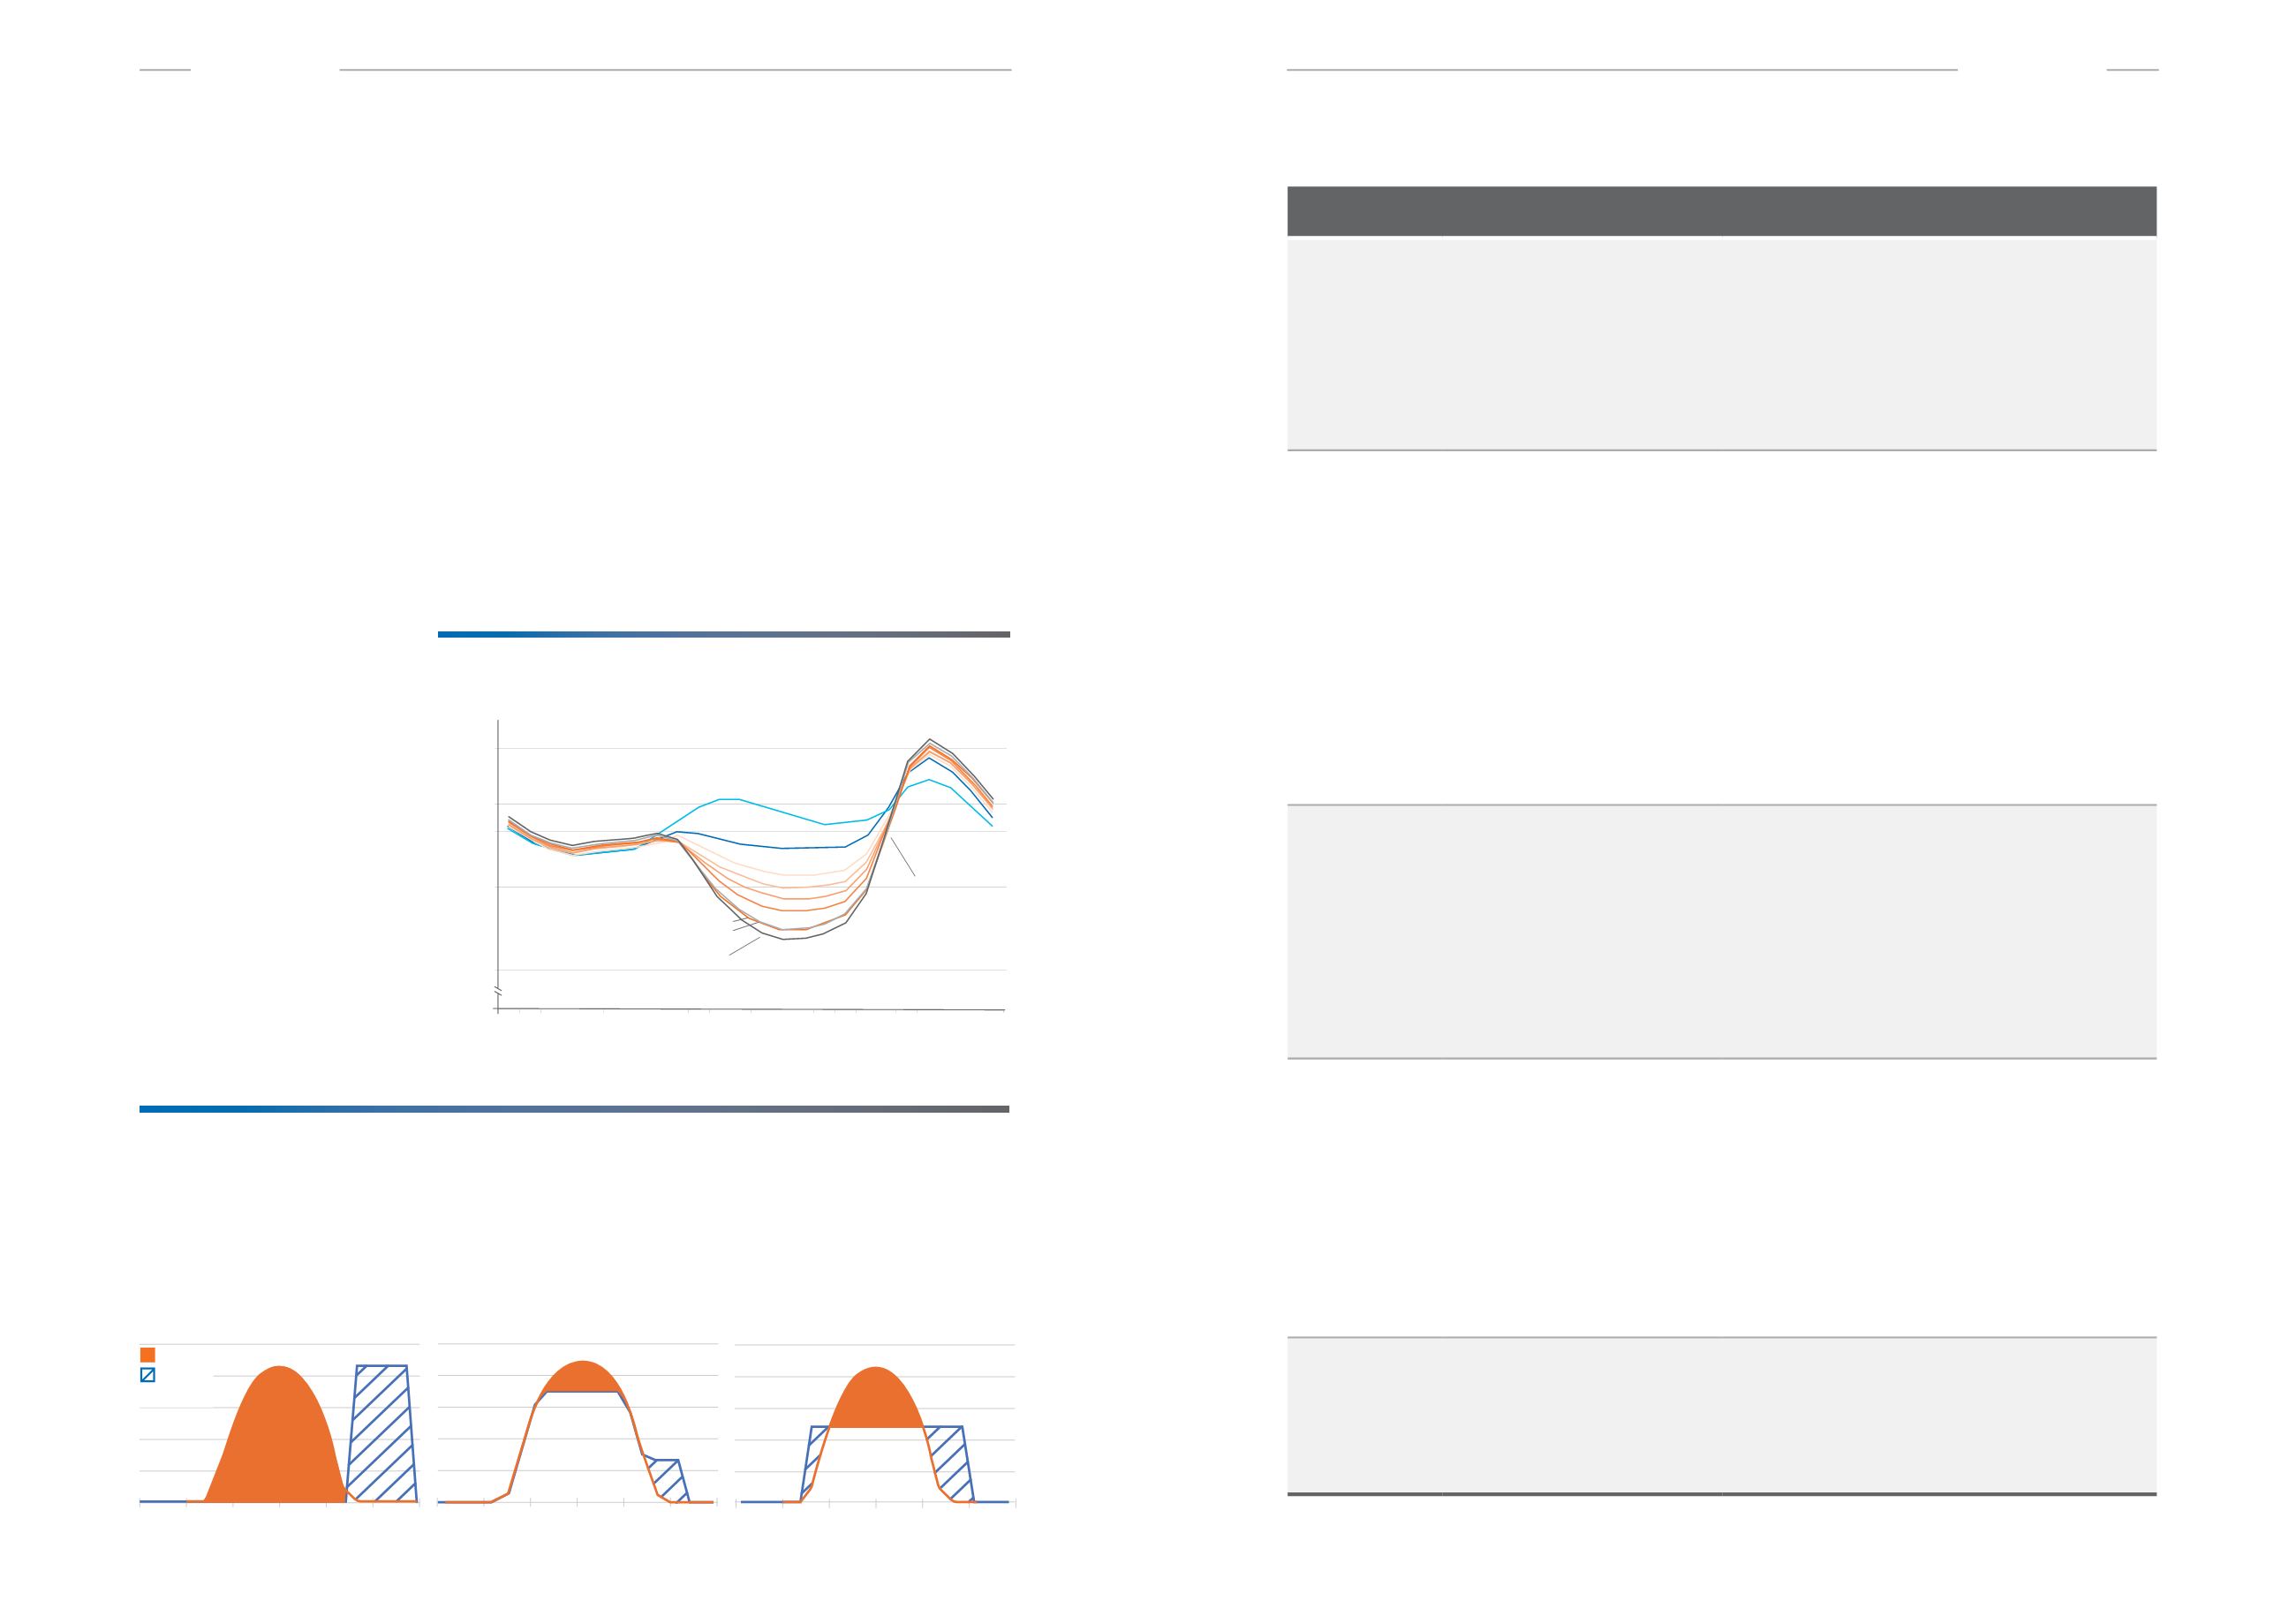
A hybrid PV plus battery storage hybrid power
plant stores energy generated by the PV portion
and selectively discharges the stored energy.
In Figure 1 below, the system is storing 100%
of the solar energy and shifting it (discharging)
later in the day in order to completely avoid
curtailment of the solar energy. Figure 2 is an
example of partial shifting approximately 30%
of the solar energy to a peak demand period
later in the day. In a solar firming application
(Figure 3), the intent is to maintain a steady plant
output at the grid point of interconnection.
0 4 8 12 16 20 24
24
Figure 3: Solar “Firming”
0 4 8 12 16 20
Figure 1: “Full shift” solar o set fuel burn
Output (KW)
0 4 8 12 16 20 24
Figure 3: Solar “Firming”
Figure 1: “Full shift” solar o set fuel burn
0 4 8 12 16 20 24
24
24
Figure 3: Solar “Firming”
0 4 8 12 16 20
Figure 1: “Full shift” solar o set fuel burn
Output (KW)
0 4 8 12 16 20
Figure 2: “Partial shift” solar to peak
Solar generation being stored
Battery
discharge
Licensed with permission from the California ISO. Any statements, conclusions, summaries or other
commentaries expressed herein do not reflect the opinions or endorsement of the California ISO.
12 /
HYBRID SOLUTIONS
/
www.gepower.com/hybrid www.gepower.com/hybrid/
HYBRID SOLUTIONS
/ 13
t rends
t rends